Novus Restaurant
Novus Restaurant is the food-market intelligence product in the Novus Stream Solutions portfolio, live at restaurant.novusstreamsolutions.com. It collects published food-price observations from eleven official statistical providers (USDA My Market News, AAFC Canada, DEFRA, FAOSTAT, FAO FPMA, the EU Agri-food data portal, the World Bank's real-time food prices programme, SNIIM Mexico, MAFF Japan, ABS Australia and Stats NZ) normalises them into comparable series across nine markets, and shows each one with the source it came from, the date that source published it, and a confidence score for the evidence behind it. The design commitment that shapes everything else: where coverage is thin or a provider is degraded, the gap is displayed as a gap. Nothing is interpolated to make a chart look complete.
Contents
What Novus Restaurant is
Most food-price information a restaurant can reach is either a supplier quote (accurate but private and unverifiable) or a news headline with no series behind it. Novus Restaurant sits in between: it reads the price series that national statistical agencies already publish, puts them in one comparable shape, and keeps the provenance attached so a number can be checked rather than believed.
The public surface needs no account. You can open the data explorer, filter by country, read how a figure was derived, and see which providers are healthy today. That public tier is the part of the product this page mostly documents, because it is the part anyone can verify.
- Eleven official statistical providers, each declared with its connection type, cadence and endpoint.
- Nine supported markets: Seven at enhanced coverage, the rest national.
- Every observation shows its source, its published (not fetched) date, and an evidence confidence score.
- Comparable movements only: series are matched before they are compared.
- Empty and degraded coverage stays visible instead of being filled with invented values.
Observed date versus fetch time
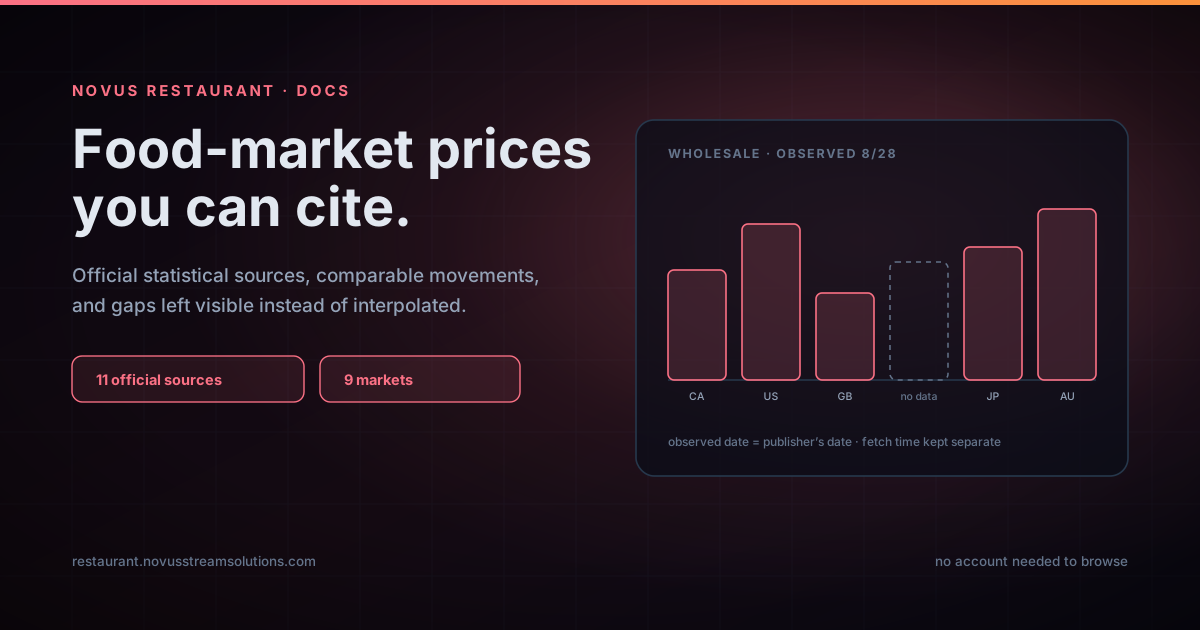
The single most important thing to understand before quoting anything from this product is the difference between two dates it deliberately keeps separate. The observed date is the date the government or institution published the figure. The fetch time is only the moment Novus last checked that source. They are not the same, and conflating them is how stale data gets presented as fresh.
The product states this on the data explorer itself rather than hiding it in a footnote, and every row carries both. A series that has not moved in three weeks looks like a series that has not moved in three weeks, not like a fresh reading, simply because a scraper ran this morning.
Where the numbers come from
The connection registry is published at /data-sources and lists every provider with its identifier, the countries it covers, how it is connected, how often it publishes, and whether an API key is required. Connections are not uniform, because the upstream sources are not: some expose a REST API, some a bulk download, some only an HTML page or a CSV that has to be discovered, and ABS Australia speaks SDMX. Cadence varies just as much: daily for USDA My Market News, AAFC Canada and SNIIM Mexico, fortnightly for DEFRA, monthly for FAO FPMA, ABS and the World Bank, dekadal for MAFF Japan.
That page is explicit that it describes configuration rather than live health: the list is what is wired up, not a promise that every endpoint answered this morning. Runtime health is an administrative view. Treating a registry entry as a guarantee of today's data is exactly the mistake the coverage page exists to prevent.
- FAOSTAT and FAO FPMA: global producer and retail series.
- USDA My Market News (US, daily), AAFC Canada (CA, daily), SNIIM Mexico (MX, daily).
- DEFRA (GB, fortnightly), EU Agri-food (EU), World Bank RTFP (selected markets).
- MAFF Japan (JP, dekadal), ABS Australia (AU, SDMX, monthly), Stats NZ (NZ).
Reading coverage honestly
Coverage, freshness and provider health each get their own public page, and they are meant to be read before the numbers are used, not after. Coverage tells you which markets and categories actually have series behind them. Freshness tells you how old the newest observation in a series is against the cadence you should expect from that provider. Provider health tells you whether a source has been answering.
The methodology and understanding-analytics pages explain how comparable movements are calculated and what an evidence confidence score is weighing. If a movement cannot be computed against a comparable baseline, the product declines to state one rather than producing a percentage that looks authoritative and is not.
The workspace, and how this app differs from the rest of the portfolio
Beyond the public explorer there is a signed-in workspace aimed at operators: menu costing, purchasing, supplier and product records, price-change tracking, savings, planning, weekly reports, and analysis surfaces built on the same series. It is free to use, and sign-up is open at restaurant.novusstreamsolutions.com/sign-up.
It is worth being straightforward that this breaks the pattern the other Novus apps follow. Everything else in the portfolio is browser-first and account-free by design: your files never leave your device, because the work happens locally. Novus Restaurant cannot work that way. It is aggregating public data published by other institutions on their schedule, which means a server, a database, and scheduled ingestion are the product rather than an accessory to it. The privacy promise here is therefore a different one, and stated as such: the data being handled is public market data, not your files.
- Public tier: data explorer, country pages, coverage, methodology, data sources, ingestion schedule; no account.
- Workspace tier: menu costing, purchasing, suppliers, products, price changes, savings, planning, reports; free, sign-in required.
- Server-side by necessity: aggregating other institutions' published data is not a client-side job.
How Novus Restaurant fits the portfolio
The thread running through the Novus apps is refusing to overstate what a tool knows. Novus AI Stats labels a metric as estimated rather than presenting it as exact. Novus Examples ships fixtures with spec sheets instead of scraped files of unknown provenance. Novus Restaurant is the same instinct applied to market data: attribute every figure, separate publication from collection, and leave the holes visible.
For tutorials, start with the data explorer walkthrough and the guide to reading coverage and freshness before trusting a series. The product blog carries the launch note and the reasoning behind the no-interpolation rule.
Frequently asked questions
Quick answers to common questions about this topic.
Is Novus Restaurant free?
Yes. The public data explorer, country pages, coverage, methodology and data-source registry need no account at all, and the signed-in workspace is free to join at restaurant.novusstreamsolutions.com/sign-up.
Where does the price data come from?
From eleven official statistical providers, including USDA My Market News, AAFC Canada, DEFRA, FAOSTAT, FAO FPMA, EU Agri-food, World Bank RTFP, SNIIM Mexico, MAFF Japan, ABS Australia and Stats NZ. Every provider is listed at /data-sources with its cadence and connection type.
How current is the data?
Ten scheduled jobs re-check the upstream providers each morning, but currency is set by the publisher, not by Novus. Each observation shows the date its source published it alongside the time Novus last fetched it, and the two are never merged.
Why are some prices missing?
Because the upstream provider has not published them, or has published something that cannot be compared to the existing series. The product shows that as an explicit gap. It will not interpolate a value to make a chart continuous.
Which countries are covered?
Nine markets: Canada, the United States, the United Kingdom, India, Mexico, Japan, Australia, New Zealand and the EU. Seven are at enhanced coverage and the remainder at national coverage; the coverage page is authoritative at any given moment.
Does it need an account like the other Novus apps?
The public data explorer does not. The workspace does, which makes this the one app in the portfolio that is not browser-first: it aggregates public data published by other institutions on their own schedule, so ingestion happens server-side rather than on your device.
Related workflow
Turn a market movement into a menu price you can defend
Start from a published food-price movement, check it is real before acting on it, and end with a costed menu sheet you can hand to a supplier or an accountant.
- Find the movement and check it is publishableNovus Restaurant: Read the observation with its published date and source identifier, then check the provider is healthy and the series is fresh for its cadence; a flat line can mean a stable price or an absent publisher, and only cadence tells you which.
- Build the costing sheet and sign itNovus PDF Studio: Assemble the figures into a document, add the fields a supplier or accountant fills in, and sign it locally so nothing leaves your device.
Related troubleshooting
Was this page helpful?
Your answer stays in this browser, it is not sent anywhere and no account or cookie is involved.