2026 · Novus RestaurantAbout 4 min readNovus Stream Solutions
Novus Restaurant: food-market data that shows its gaps
Novus Restaurant is live at restaurant.novusstreamsolutions.com. It reads food-price series published by eleven official statistical agencies, normalises them across nine markets, and keeps the source, the publication date and a confidence score attached to every figure, leaving gaps visible rather than interpolating them away.
Contents
Overview
Novus Restaurant is live at restaurant.novusstreamsolutions.com, and it is the ninth app in the portfolio. It reads the food-price series that national statistical agencies already publish (eleven of them) normalises them into comparable shape across nine markets, and shows each observation with the source it came from, the date that source published it, and a confidence score for the evidence behind it.
The interesting design decision is not what it shows. It is what it refuses to show.
The problem with every food-price number you can currently get
If you run a kitchen and want to know what an ingredient costs, you have two realistic options and both are bad. You can ask a supplier, which gives you an accurate number that is private, unverifiable, and specific to your relationship. Or you can read a headline about food inflation, which gives you a claim with no series behind it and no way to check what was actually measured.
Meanwhile, a great deal of this data is already public. USDA My Market News publishes wholesale prices daily. AAFC does the same for Canada. DEFRA, FAOSTAT, the EU agri-food portal, SNIIM in Mexico, MAFF in Japan, ABS in Australia, Stats NZ: all publishing, all in different formats, on different schedules, in different units, with different definitions of what a "carton" is. The data is not missing. It is unusable in the shape it arrives in.
What we built
The product connects to eleven official providers and normalises what they publish into series that can actually be compared. The connection registry is public: every provider is listed with the countries it covers, how it is connected (REST, bulk download, HTML, a CSV that has to be discovered, or SDMX for ABS Australia) how often it publishes, and whether a key is required.
Ten scheduled jobs re-check those sources every morning. Nine markets are supported: Canada, the United States, the United Kingdom, India, Mexico, Japan, Australia, New Zealand and the EU, seven of them at enhanced coverage.
- FAOSTAT and FAO FPMA: global producer and retail series.
- USDA My Market News (US), AAFC Canada, SNIIM Mexico: daily.
- DEFRA (fortnightly), EU Agri-food, World Bank RTFP (monthly).
- MAFF Japan (dekadal), ABS Australia (SDMX), Stats NZ.
Two dates that must never be merged
Every observation carries an observed date and a fetch time, and the product keeps them rigidly apart. The observed date is when the agency published the figure. The fetch time is only when our ingestion job last checked.
Collapsing those into one "last updated" field is the most common way price data lies. A row fetched at 7am today can carry an observation from three weeks ago, and a single timestamp would present that as fresh. Both dates appear on every row, and the explorer says so in plain language rather than burying it in a methodology footnote.
Why we leave the holes in
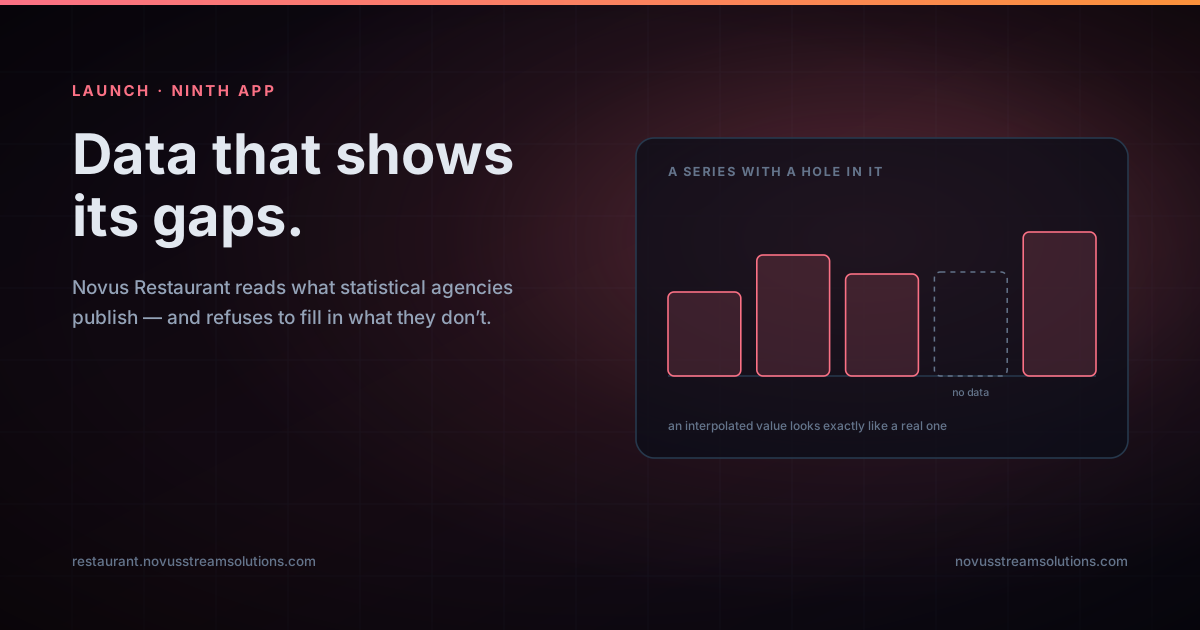
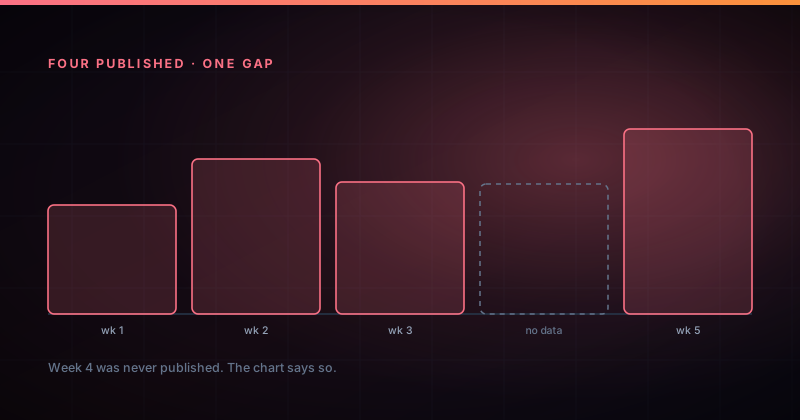
Where a series has no comparable reading, Novus Restaurant shows a gap. Where a provider is degraded, it says so instead of quietly serving the last good value. Where a movement cannot be computed against a genuinely comparable baseline, it declines to state a percentage at all.
This makes some screens look emptier than a competitor's, and that is a real cost we accepted deliberately. The reason is simple: an interpolated value looks identical to a published one once it is drawn on a chart. Nobody reading it later can tell them apart, including you, three months on, when you are trying to work out why a costing was wrong. A visible gap is an honest signal that the next step is the publishing agency itself.
This is the same instinct that runs through the rest of the portfolio. Novus AI Stats labels a metric as estimated rather than dressing it up as exact. Novus Examples ships fixtures with spec sheets instead of scraped files of unknown provenance. The pattern is refusing to let confidence outrun evidence.
The one app in the portfolio that needs an account
Worth stating plainly, because it breaks a promise we make everywhere else. Every other Novus app is browser-first and account-free: your files never leave your device, because the processing happens locally. Novus Restaurant cannot work that way. Aggregating data that other institutions publish on their own schedules requires a server, a database and scheduled ingestion; that is the product, not an accessory to it.
So the split is explicit. The public data explorer, the country pages, coverage, freshness, methodology, the ingestion schedule and the source registry are all open with no account. The operator workspace (menu costing, purchasing, suppliers, products, price changes, savings, planning and weekly reports) is free but requires a sign-in, because it holds your records alongside the public series. The data being handled here is public market data, not your files, and the privacy stance is written for that reality rather than copied from the other apps.
- Public, no account: /data, country pages, /coverage, /methodology, /data-sources, /ingestion-schedule.
- Free with sign-in: menu costing, purchasing, suppliers, price changes, savings, reports.
- Server-side by necessity, and said out loud rather than glossed over.
Where to start
Open the data explorer and pick a market. Read one row properly: the value, the unit it was published in, the date its agency released it, and the source identifier. Then follow that identifier to the registry and see exactly who published it and how often they do.
The two tutorials cover that first pass and the more important second habit: checking coverage and freshness before trusting a series at all. Full documentation is at Novus Restaurant and the tool map at Tool maps.
Frequently asked questions
Quick answers to common questions about this topic.
Is Novus Restaurant free?
Yes. The public data explorer, country pages, coverage, methodology and the source registry need no account at all. The operator workspace is also free and asks only for a sign-in.
Where does the data come from?
From eleven official statistical providers, including USDA My Market News, AAFC Canada, DEFRA, FAOSTAT, FAO FPMA, EU Agri-food, World Bank RTFP, SNIIM Mexico, MAFF Japan, ABS Australia and Stats NZ. Every one is listed publicly with its cadence and connection type.
Why are some prices missing?
Because the publishing agency has not released them, or has released something that cannot be compared to the existing series. We show that as a gap rather than filling it with an estimate that would be indistinguishable from a real figure later.
How current is the data?
Scheduled jobs re-check every provider each morning, but currency is set by the publisher, not by us. Each observation shows its published date separately from our fetch time, so you can always tell which is which.
Why does this app need an account when the others do not?
Only the workspace does. The public data is open. The difference is that this product aggregates data other institutions publish on their own schedules, which needs server-side ingestion, unlike the browser-first apps, where the work happens on your device.
Related workflow
Turn a market movement into a menu price you can defend
Start from a published food-price movement, check it is real before acting on it, and end with a costed menu sheet you can hand to a supplier or an accountant.
- Find the movement and check it is publishableNovus Restaurant: Read the observation with its published date and source identifier, then check the provider is healthy and the series is fresh for its cadence; a flat line can mean a stable price or an absent publisher, and only cadence tells you which.
- Build the costing sheet and sign itNovus PDF Studio: Assemble the figures into a document, add the fields a supplier or accountant fills in, and sign it locally so nothing leaves your device.
Related troubleshooting
Was this page helpful?
Your answer stays in this browser, it is not sent anywhere and no account or cookie is involved.