Novus Restaurant
Find a food price you can actually cite
Open the public Novus Restaurant data explorer with no account, narrow it to one of nine supported markets, and read a single observation properly: its source, the date its publisher released it, and the confidence score behind it.
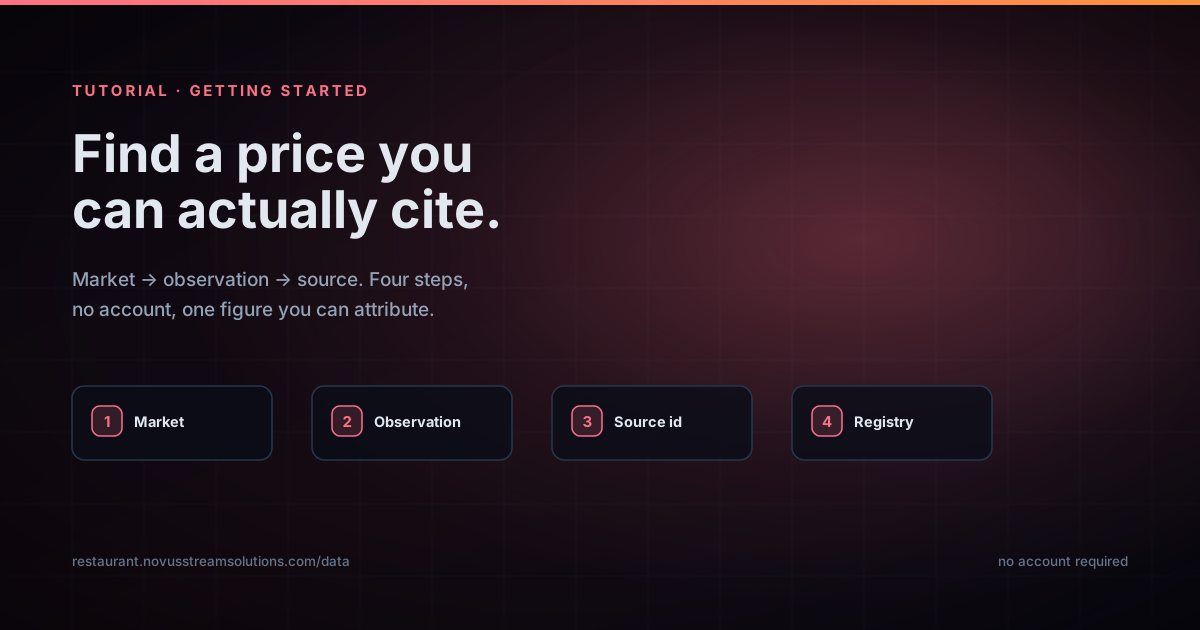
Most food-price numbers you can find are either private (a supplier quote) or unattributable (a headline). Novus Restaurant exists to produce a third kind: a figure you can trace to the institution that published it. This tutorial gets you to one.
Nothing here needs an account. The public data explorer, the country pages and the whole reference set are open, which is deliberate: a sourcing claim you cannot check is not worth much.
Contents
Two ways to finish
Browse the public explorer
No account, no sign-up. Start reading observations immediately.
Trace one figure end to end
Follow a single price back to the agency that published it.
- 1
1. Open the explorer and understand what you are looking at
Go to restaurant.novusstreamsolutions.com and choose Explore data. The landing view shows recent market series: each row is one observation of one item, in one market, at one level of trade (wholesale or retail), with the currency and unit it was published in.
Read the unit carefully before anything else. Food-price series are published in whatever unit the source uses, and "cartons 12 4-oz packages" is not comparable with "22 lb cartons" no matter how similar the two items sound. The product keeps the original unit rather than silently converting.
- Every row carries its market, its level of trade, and its published unit.
- The public explorer needs no account.
- 2
2. Narrow to a market
Use the country pages to scope to one of nine supported markets: Canada, the United States, the United Kingdom, India, Mexico, Japan, Australia, New Zealand or the EU. Seven of those are at enhanced coverage; the rest are national.
Scoping matters more than it looks. A market with a daily publisher behind it (USDA My Market News for the US, AAFC for Canada, SNIIM for Mexico) will feel alive; a market whose provider publishes monthly will not, and that is a property of the source, not a fault in the tool.
- Country pages live at /data/<country>, for example /data/ca.
- Coverage tier tells you how much depth to expect before you start looking.
- 3
3. Read one observation properly
Pick a single row and look at all four things it tells you. The value and unit are the obvious pair. The other two are the ones that make the figure citable: the observed date, and the source identifier.
The observed date is when the publishing agency released the figure. The fetch time (shown separately as "Fetched by Novus") is only when the ingestion job last checked. These are never merged, and the distinction is the single most important habit to build here. A row fetched this morning can carry an observation three weeks old, and that is not a bug; it means the publisher has not released anything newer.
The source identifier (usda_mmn_us, aafc_ca, defra_uk and so on) is what makes the number attributable. That string maps to a row on the data-sources registry, which names the agency, the connection type and the expected cadence.
- Observed date = the publisher’s date. Fetch time = when Novus checked. Never the same field.
- Evidence confidence is scored out of 100. Treat it as a quality signal, not a precision claim.
- The source id resolves to a named agency on /data-sources.
- 4
4. Follow the figure back to its source
Open /data-sources and find the identifier from your row. The registry lists all 11 providers with the countries they cover, how the connection is made, how often they publish, and whether an API key is required.
Read the caveat on that page rather than skipping it: the registry describes configuration, not live health. It tells you what is wired up, not that every endpoint answered this morning. That is what the coverage and freshness views are for, and they are the subject of the next tutorial.
- All 11 providers are official statistical sources: USDA, AAFC, DEFRA, FAOSTAT, FAO FPMA, EU Agri-food, World Bank RTFP, SNIIM, MAFF, ABS and Stats NZ.
- Cadence varies from daily to monthly. Check it before calling a series stale.
- 5
5. Know when the product refuses to answer
Sooner or later you will find an item with no movement percentage, or a market view with visible holes in it. That is the product working as designed. Where there is no comparable baseline, Novus Restaurant declines to compute a movement rather than producing a number that looks authoritative and is not.
Empty and degraded coverage stays visible instead of being filled with invented values. If you need a figure for a gap, the honest next step is the publishing agency itself, not a smoothed estimate.
Habits that keep a figure defensible
Read the unit before the number: food-price series are published in whatever unit the agency uses, and "cartons 12 4-oz packages" will never be comparable with "22 lb cartons" no matter how alike the two items sound. Copy the source identifier alongside any figure you record, because that string is what lets you or anyone else trace it back months later. And treat a blank movement as information rather than a missing feature: it means no comparable baseline existed, which is worth knowing before you price against it.
Frequently asked questions
Quick answers to common questions about this topic.
Do I need an account to browse the data?
No. The data explorer, country pages, coverage, methodology, ingestion schedule and data-source registry are all public. Only the operator workspace requires a sign-in, and that is free too.
Why does a price show no percentage change?
Because there is no comparable baseline to measure it against. Rather than invent one, the product leaves the movement blank.
Is the data live?
Scheduled jobs re-check the providers every morning, but freshness is set by the publisher. Each row shows its published date separately from the time Novus fetched it, so you can always tell the difference.
Related workflow
Turn a market movement into a menu price you can defend
Start from a published food-price movement, check it is real before acting on it, and end with a costed menu sheet you can hand to a supplier or an accountant.
- Find the movement and check it is publishableNovus Restaurant: Read the observation with its published date and source identifier, then check the provider is healthy and the series is fresh for its cadence; a flat line can mean a stable price or an absent publisher, and only cadence tells you which.
- Build the costing sheet and sign itNovus PDF Studio: Assemble the figures into a document, add the fields a supplier or accountant fills in, and sign it locally so nothing leaves your device.
Related troubleshooting
Was this page helpful?
Your answer stays in this browser, it is not sent anywhere and no account or cookie is involved.