2026 · Novus Stream Solutions (hub)About 14 min readNovus Stream Solutions
Analytics for a small site without invasive tracking
Most small sites bolt on a heavyweight analytics suite, consent banner and all, to answer questions a log file could handle. Here is how I decide what actually needs measuring, what server logs and cookieless counters each see, how to read small numbers honestly, and exactly how our GA4-behind-consent setup works.
Contents
- 1.Overview
- 2.Start from decisions, not dashboards
- 3.What the server already knows
- 4.What a client script buys you, and what it costs
- 5.The cookieless middle ground
- 6.Small numbers mislead before they lie
- 7.The two or three numbers I actually watch
- 8.Our worked example: GA4 behind a real consent gate
- 9.A setup you can run with a clear conscience
Overview
There is a reflex that fires the moment a new site goes live: paste in the analytics tag, wire up a cookie banner to make it legal, and move on. Nobody decides this, exactly; it is ambient practice, absorbed from every tutorial and every agency checklist, and for a small site I think it is backwards. You take on a heavyweight surveillance instrument, a legal obligation, a slower page, and a banner that irritates every single visitor, in exchange for a dashboard whose forty reports you will read approximately twice. The data collected vastly exceeds the decisions it informs, and the excess is not neutral: it is weight, liability, and a small tax on every reader’s patience.
I run this site, and the tools attached to it, with the opposite bias. Our products’ core pitch is that your files never leave your device, so smothering the marketing site in trackers would be a strange way to introduce ourselves: the measurement posture is part of the product’s character, not a separate compliance chore. That pushed me to treat analytics like any other dependency: start from zero, add the smallest instrument that answers a real question, and make anything heavier justify itself. What surprised me is how little was left after that filter, and how little I miss what went.
This guide is the full reasoning, in the order I actually apply it: which decisions genuinely need data on a small site; what the server already knows without any script; what a client-side script adds and what it costs; the cookieless middle ground and its honest legal caveats; why low-traffic numbers mislead and how to read them anyway; the two or three figures I actually watch; and, as a worked example, the consent-gated GA4 configuration this site runs, including the parts of that choice I would not repeat if I were starting today.
Start from decisions, not dashboards
A metric earns its collection cost only if some decision changes when it moves. That is the entire test, and it is brutal when applied honestly. Run a small content site or a small tool for a year and write down every decision you actually took that data influenced; my own list is short enough to be embarrassing. What to write next. Whether a change helped. Which of several pages deserves the internal links. Whether anything is broken. Whether the site is getting slower for real visitors. That is more or less the complete list, and it should be the specification your analytics setup is built against, rather than the other way around.
Written as questions with their minimum data requirements, the list looks like this, and notice how modest the requirements are:
Now hold that list against what a full analytics suite collects by default: individual-level journeys, session stitching across days, demographic and interest profiles, granular event streams. For a small site, none of it maps to a decision. I have never chosen a topic because of a visitor’s inferred age bracket, and neither have you. Those features exist because the suites were built for organisations with funnels to optimise and ad budgets to attribute; they are precisely the features that make the tooling invasive enough to need a banner. Declining them costs a small site nothing, which is the central, liberating fact this whole subject turns on.
- What should I write or build next? Needs page-level attention data, even coarse counts.
- Did the change I shipped help or hurt? Needs one number, comparable before and after.
- Where do visitors come from? Needs referrer data, which every request already carries.
- Is anything broken? Needs status codes and error rates, which logs already record.
- Is the site getting slower for real people? Needs field performance data, the one thing only a client script can see.
What the server already knows
Before adding any instrument to the page, it is worth inventorying what you are already collecting by virtue of serving requests at all. Every visit hits a server or a CDN edge, and that infrastructure records the path requested, the status code returned, the referrer header, a rough geography, and a timestamp. No script, no cookie, no consent banner, and no ad-blocker in the world can hide a request from the thing serving it. For the questions “where do visitors come from” and “is anything broken,” this is not an approximation of an answer; it is the answer, sitting in a log you probably have not opened.
Two caveats keep log reading honest. First, bots: a startling fraction of raw requests are crawlers, scrapers, and scanners, so raw totals flatter you: filter by user agent and look at HTML page requests rather than every asset before believing any count. Second, caching: if a CDN serves most of your traffic from its edge, your origin logs see only the misses, which quietly undercounts everything; the fix is to read the CDN’s own edge-side analytics rather than the origin’s, since the edge sees every request including the cached ones. Both adjustments take minutes and change the numbers substantially.
What logs cannot give you is engagement: they see requests, not attention, so they cannot distinguish a visitor who read the whole guide from one who bounced in four seconds. For a while I treated that as a serious gap. In practice, for a content site, page-level request counts plus referrers turned out to cover most of the decision list from the previous section, and the hosting dashboards and CDN analytics that surface them are free at small-site scale. The instrument you already own, correctly read, is a better starting point than most people’s configured suite.
What a client script buys you, and what it costs
A script running in the visitor’s browser can see things no log ever will, and honesty requires naming them properly rather than dismissing them. It can follow a visitor across pages within a visit, revealing which articles lead readers deeper and which are dead ends. It can report field performance: Core Web Vitals as experienced on real devices over real connections, which no lab test replicates and which I genuinely care about. It can catch client-side JavaScript errors that never touch the server. These are real capabilities, and two of them, field performance and error reporting, have no server-side substitute at all.
The costs are equally concrete. There is page weight and a third-party request on every load, paid by every visitor so that you can occasionally glance at a chart. There is the dependency itself: one more external party with a tag on your site. And there is the pivotal cost: the moment the script persists an identifier on the visitor’s device to recognise them later, you have crossed into the territory that consent regimes regulate, and you owe every visitor a banner. The banner is the tax that should get budgeted and almost never is: a modal interruption, on every first visit, forever, charged against the reader’s patience for data that mostly decorates a dashboard.
So the rule I apply is that the script must earn the seat: it has to answer a question from the decision list that logs and lighter instruments cannot, and the answer has to be one I will act on. Field performance clears that bar for me: we make performance promises, and I want them checked against reality. Cross-page journeys mostly do not clear it; at small-site scale the “content flow” reports are too sparse to redesign anything around. Framed that way, the choice stops being “analytics: yes or no” and becomes “which specific capabilities justify their specific costs,” which is a question with tractable answers.
Small numbers mislead before they lie
Whatever instrument you choose, a small site faces a problem no tool fixes: at low traffic, noise dwarfs most real effects. At a few hundred visits a day, ordinary day-of-week rhythm, one stray link from a forum thread, or a single crawler misclassified as human will move your totals by double-digit percentages, which means the Tuesday-versus-Monday comparison that looks like a trend is usually weather. The dashboards do not help, because they render every wiggle at full dramatic resolution and invite a story about each one. The discipline has to come from the reader of the numbers, not the software.
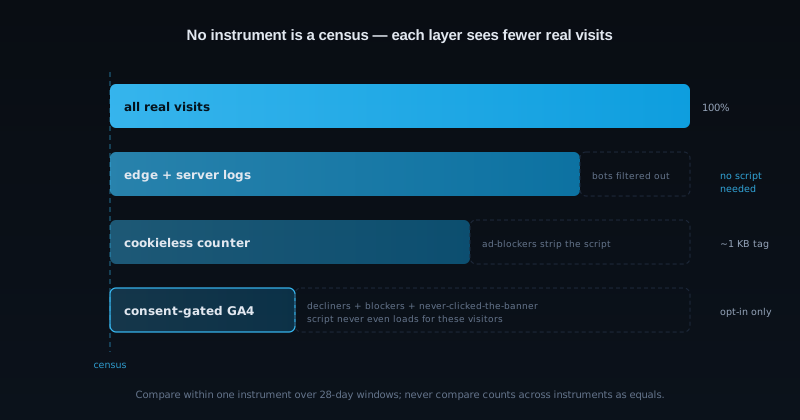
There is a second, subtler problem: none of your instruments is a census, and each one omits a different slice. Ad-blockers strip analytics scripts: for a technical audience, a very large slice. A consent banner removes everyone who declines. Logs include bots that filtering never perfectly removes. So every number is a sample with an unknown and slowly drifting bias, and the practical consequences are strict: never compare figures across instruments as if they measured the same thing, never switch instruments mid-experiment, and treat direction-over-weeks as meaningful where absolute levels are not. The fuller statistical treatment (what sample sizes can and cannot support) is in Measuring honestly when the numbers are small.
Three working rules keep me honest. Every number I write down gets its instrument named next to it: “clicks (Search Console)” and “visits (edge count)” are different animals and recording them unlabelled is how future-me gets fooled. Comparisons use twenty-eight-day windows, which wash out weekday rhythm and dilute one-off spikes. And any single-day spike stays classified as “unexplained” until a referrer or a log line explains it. Most turn out to be one link, one bot, or one newsletter, and none of those is a trend. Small numbers are perfectly usable under these rules; they are only dangerous when read with big-number habits.
The two or three numbers I actually watch
After all the theory, my working dashboard is three numbers, and the first is not even on my infrastructure: search impressions and clicks from Search Console, read as a monthly trend. It is measured server-side at Google, requires no script and no consent from anyone, and answers the question that actually governs a content site’s trajectory: is demand for what we publish growing or shrinking. If I were allowed one instrument only, this would be it, and it is free.
The second number is page-level: which pages earn organic entrances, straight from the same Search Console data. That single ranking drives most real decisions (what to write next, which older posts deserve refreshing, where internal links should point), and it feeds the content-maintenance rota directly. The third is a health number: field Core Web Vitals from real visitors, with a client error count next to it. That is the entire panel. The general argument for radical metric reduction (that a number you will not act on is decoration) is one I have made at length in Analytics that matter: separating signal from vanity.
Everything else is pulled on demand, not displayed on a dashboard. When a specific decision needs a specific figure (did traffic to one page change after a rewrite, where did a spike come from), I go get it, use it, and let it go. The distinction sounds cosmetic and is not: a dashboard is an invitation to check, and ambient checking generates ambient anxiety plus stories about noise. A panel of three trend lines, read weekly, supports every decision the site actually faces, and it makes the invasive machinery of the big suites look like what it is for a site this size, which is scaffolding for decisions we are not making.
Our worked example: GA4 behind a real consent gate
Now the confession and the worked example in one. This site runs GA4, the heavyweight option, but behind a gate that changes its character completely. The analytics tag is not in the page. First paint contains no analytics script, no pre-loaded tag manager, no consent-mode beacon phoning home in “denied” state. Nothing. A visitor who arrives, reads three guides, and leaves has made zero contact with Google Analytics. A banner explains that optional analytics cookies exist and offers a genuine choice, with decline given equal visual weight to accept.
The mechanics are almost embarrassingly simple. The visitor’s choice is stored in localStorage under a single key. Only an explicit accept causes the site to create the script element and inject the GA4 tag into the page; a decline persists the refusal and the analytics code simply never loads. This is not consent mode with limited pings; it is the literal absence of the script. On a return visit the stored choice is read after hydration and honoured silently, so nobody is re-interrogated. Our Cookie policy page documents all of it and lets anyone change their answer later. The entire implementation is a banner component and roughly forty lines of gating logic.
The honest consequences: GA4 sees only the consenting subset, which is some unknowable fraction of real traffic, so its absolute counts are useless and we treat them as such. What it provides is texture (rough page popularity among consenters, coarse geography, field performance from real devices) while Search Console and edge-side request counts, which need no consent, carry the actual trend lines. In the funnel diagram above, GA4 is the narrowest bar, and we sized our reliance on it accordingly: it seasons the picture, it never is the picture.
Would I build it this way again? Probably not, and that is the useful part of the example. The gate exists to make a heavyweight tool ethical; a cookieless counter would make the gate unnecessary and hand back the banner’s UX tax, at the price of coarser data we barely use anyway. GA4 stays for now because the field-performance reporting is genuinely good and because migrations have costs too. But if you are starting from a blank page, my honest advice is to skip ahead of us: pick the light instrument first, and let the heavy one argue its way in later, rather than installing it by reflex and gating it into near-uselessness the way we did.
A setup you can run with a clear conscience
Collapsed into prescriptions, the decision tree is short. A pure content site needs Search Console plus its host’s or CDN’s request counts, and genuinely nothing else: that combination answers demand, sources, and breakage without a single byte of tracking script. A site with interactive tools earns a cookieless counter for page-level texture, and possibly a lightweight field-performance beacon, because performance promises deserve verification. The full consent-gated suite is the last resort, justified only when you can name the reports you will read and the decisions they feed; if you cannot, that is your answer.
Whatever tier you land on, write two things down while you are still calm: the two or three numbers that constitute your panel, and the cadence for reading them. Mine is weekly, which is frequent enough to catch anything that matters on a site this size and infrequent enough to keep the numbers from becoming a mood ring; the case for scheduled reading over ambient dashboard-checking is made properly in Calm analytics: reading your numbers without the anxiety spiral. An analytics setup is not just an instrument, it is a habit you are designing for yourself, and the habit does more damage or good than the tool choice does.
The deeper point is that measurement is never free (it costs bytes on every page load, a sliver of every reader’s trust, and a share of your own attention), and those costs are real whether or not the data gets used. A small site that measures little and reads it carefully understands itself better than one that hoards events it never opens, and it treats its visitors better along the way. Respect for the reader turns out to be a sound analytics strategy: collect what decisions require, gate or skip what they do not, and spend the attention you save on making the site worth visiting.
Frequently asked questions
Quick answers to common questions about this topic.
Do I need Google Analytics on a small website?
Usually not. List the decisions you actually make from data (what to publish next, whether a change helped, where visitors come from, whether anything broke) and most are answered by Search Console plus your host’s or CDN’s request counts, neither of which needs a script or a consent banner. A full suite earns its place only when you can name specific reports you will read and act on. Installing it by reflex buys page weight, a legal obligation, and a banner that taxes every visitor for data that mostly goes unread.
Are cookieless analytics tools automatically GDPR compliant?
Not automatically: “cookieless” is a design posture, not a legal exemption. European rules regulate access to device storage and processing of personal data broadly, and even briefly hashing an IP address counts as processing. Tools like Plausible, Fathom, GoatCounter, and Umami are built to avoid persistent identifiers and to sit comfortably in the consent-light zone, and their designs are credible, but regulator positions have varied by country and tool. Read the vendor’s data-processing documentation, consider your own jurisdiction, and make a considered call rather than trusting a homepage badge.
What can server logs tell me without any analytics script?
More than most people expect: every request already records the path, status code, referrer, rough geography, and timestamp, so logs answer “where do visitors come from” and “is anything broken” outright, with no script, no cookie, and no way for an ad-blocker to interfere. Two corrections keep them honest: filter out bot traffic before trusting totals, and if a CDN serves cached pages, read the CDN’s edge analytics instead of origin logs, which only see cache misses. What logs cannot measure is engagement or real-device performance.
How accurate are analytics numbers on a low-traffic site?
Treat every figure as a biased sample, not a census. Ad-blockers strip analytics scripts, consent banners remove decliners, and bot filtering is never perfect, so each instrument sees a different subset of real visits, and at a few hundred visits a day, ordinary noise moves totals by double-digit percentages. The workable posture: never compare numbers across different instruments, use twenty-eight-day windows instead of day-to-day reads, label every recorded figure with its source, and trust direction over weeks rather than absolute levels or single-day spikes.
How does a consent-gated analytics setup actually work?
The analytics script is left out of the page entirely, and a banner offers a real choice with decline as easy as accept. The visitor’s answer is stored locally in the browser; only an explicit accept injects the analytics tag, while a decline persists and the script never loads: not limited pings, literal absence. Return visits read the stored choice silently, and a policy page lets anyone change it later. The trade-off is that the tool then sees only consenting visitors, so its counts become texture while consentless sources like Search Console carry the trends.
Related troubleshooting
Was this page helpful?
Your answer stays in this browser, it is not sent anywhere and no account or cookie is involved.